


Quality/GMPs
Latest News


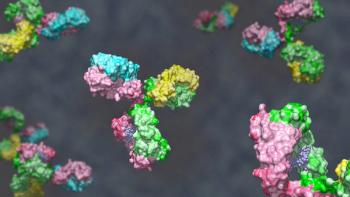
Clinical Success for CNS mAbs Depends on More Than Mechanisms of Action Alone
By Bill Holt
Advertisement
Digitalization of QbD Risk Assessments
The digital transformation of quality-by-design assessment workflows can improve efficiency, reduce human errors, and facilitate integration within a much broader digital ecosystem.

Subjectivity in Quality Risk Management
The authors discuss subjectivity in the ICH Q9 (R1) guidance document.

Phase-appropriate Compliance for Cell and Gene Therapies
Understanding how to apply phase-appropriate GMPs is crucial for achieving successful regulatory approval.

Latest Videos


Advertisement
More News

The supplemental approval is based on immunogenicity data from the STRIDE-13 phase 3 trial and, according to Merck, makes the vaccine the only one of its type specifically indicated for this at-risk pediatric population in the United States.
Johnson & Johnson reported that the MonumenTAL-3 trial showed 24-month progression-free survival up to 81.3% and overall survival up to 89.2% with the GPRC5D bispecific combination versus standard of care.

FDA has approved Organon's tocilizumab-bavi (Tofidence) for CAR T-cell–induced CRS and hospitalized COVID-19 in adults and children aged 2 years or older.

According to Eli Lilly and Company, the extended dosing interval reduces maintenance injections to as few as 6 per year without required topical corticosteroids.

The approval is based on phase 3 non-inferiority data from the IRAKLIA study, making isatuximab the first anticancer therapy administered via an on-body injector in the EU.

Agilent’s Dr. Ganesh Bala explains how MAM-based LC–MS peptide mapping has become a foundational analytical tool for ADC and bioconjugate CQA monitoring in this Q&A piece.

Contract development and manufacturing organizations can assist the sponsor company in ensuring sterility assurance in alignment with the EU’s Annex 1 guidelines.

Risk-based ADC cleaning validation must integrate degradation profiling, HBEL-aligned analytical methods, and dual large/small molecule strategies for facility safety, according to STERIS technical services director, Paul Lopolito.

The Phase 3 CANOPY-HCH-3 data show statistically significant gains in annualized growth velocity, standing height, and arm span at 52 weeks; regulatory filings planned for Q3 2026.

FDA’s approval of Immgolis and Immgolis Intri introduces the first golimumab biosimilars for rheumatoid arthritis and ulcerative colitis in the United States.

Abzena’s Dr. Jeffrey C. Mocny and Cellares’ Anna McMahon discuss how biopharmaceutical risk-based standards accelerate innovation and speed-to-market by leveraging data for better patient outcomes and safety.

The approval of zenocutuzumab-zbco for NRG1 fusion-positive cholangiocarcinoma expands precision oncology options for patients with rare molecularly defined cancers.

FDA’s extended review of a subcutaneous formulation of lecanemab highlights ongoing regulatory evaluation of alternative anti-amyloid delivery approaches for early Alzheimer’s disease.

Data from a phase 3 study show statistically significant improvements in proptosis and diplopia, along with favorable tolerability, which support regulatory advancement of elegrobart, a subcutaneous IGF-1R–targeting therapy for chronic autoimmune disease.

MRM Health’s MH002 gains FDA fast track, advancing microbiome-based therapy targeting immune modulation in ulcerative colitis patients.

BeOne Medicines’ tislelizumab and zanidatamab show improved survival in HER2+ GEA, highlighting combination immunotherapy advances in gastroesophageal cancer.

Henlius and Organon have secured approval in Europe for its pertuzumab (POHERDY) biosimilar, expanding biosimilar access for HER2-positive breast cancer treatment across oncology settings.

FDA has granted priority review to Johnson & Johnson's nipocalimab for warm autoimmune hemolytic anemia, a rare disorder with no approved US therapies.

CHMP has supported intrathecal onasemnogene abeparvovec, Novartis' gene therapy for 5q SMA in patients aged 2 years and older in the EU.

ADC cleaning validation requires risk-based strategies to manage degradation and ensure safe limits for highly potent, dual-modality therapeutics, says Paul Lopolito, STERIS’ director of Technical Services, at INTERPHEX 2026.

Savara’s inhaled GM-CSF therapy for autoimmune PAP faces delayed review, potentially postponing access to a treatment targeting impaired lung function

FDA approval of a denosumab (Prolia) biosimilar and dual filing acceptances by FDA and EMA for an omalizumab (Xolair) biosimilar candidate from Teva signal increasing competition in the biosimilar markets as well as expanded access for allergy and immunology patients.

The approval introduces a one-time gene therapy for LAD-I that restores immune function and addresses the underlying cause of a life-threatening pediatric disease.

FDA’s approval of a high-dose nusinersen from Biogen improves SMA treatment durability and supports evolving therapy sequencing strategies in a competitive neuromuscular market.

GSK’s B7-H3-targeted ADC has shown durable responses in SCLC, supporting regulatory momentum and advancing targeted approaches for high-unmet-need lung cancers.
Advertisement
Advertisement