


BioBusiness
Latest News
Advertisement
Latest Videos


Advertisement
More News
Boehringer Ingelheim has started a phase 2 trial of BI 3034701, an investigational triple GLP-1/GIP/NPY2 receptor agonist for obesity and overweight.
Deck Bio’s Dr Johanna K. Kaufmann spoke at BIO 2026 about how the company’s multi-peptide major histocompatibility complex T cell engager strategy aims to expand patient eligibility and overcome solid tumor heterogeneity and antigen escape resistance.

FDA has granted priority review to obinutuzumab (Gazyva) for primary membranous nephropathy after phase 3 MAJESTY trial results showed superior remission versus tacrolimus.

Innovent Biologics and Spero Therapeutics have signed a $1.1 billion licensing deal for IBI355, a phase 2-ready Fc-silent anti-CD40L antibody planned for testing in IgG4-related disease and Sjögren's disease.

GSK reports that dostarlimab (Jemperli) monotherapy achieved sustained clinical complete responses in the phase 2 AZUR-1 trial for dMMR/MSI-H locally advanced rectal cancer, with data to be submitted for regulatory review.

The annual gathering in San Diego showcased the industry's pivot toward complex molecules, flexible manufacturing, and human-based drug discovery — while candid conversations about capital access, deal strategy, and preclinical predictability reflected a sector navigating pressure with optimism.

CNS monoclonal antibody therapies demand rigorous screening and monitoring to ensure patient safety in MS, NMOSD, and Alzheimer disease.
FDA reported that the PRECISION-T trial showed 78% chronic GVHD-free survival at 1 year versus 38.4% with standard transplant and granted the approval to Orca Biosystems, making the therapy the first Treg cell–based therapy in blood cancers.

The European Investment Bank-backed investment establishes a new single-use GMP facility with which Icosagen can support complex protein therapeutics from early discovery through phase 1/2 clinical manufacturing.
New York-based biotech enters Nasdaq through JATT II merger, betting IL-13 × IL-18 dual blockade can break the efficacy ceiling in I&I

Lumvoa gains FDA approval for thyroid eye disease, adding an IGF-1R antagonist supported by phase 3 active and chronic TED trials.
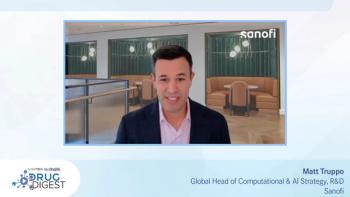
Industry experts from Sanofi, GxP Frame, and Open Biopharma outline how AI is transforming drug discovery, manufacturing, and workforce strategy through biopharma partnerships in the latest episode of Drug Digest.
Crystalys Therapeutics CEO Dr James Mackay explains at BIO 2026 that gout remains an underserved therapeutic are and represents a compelling drug development target due to its unmet need and simple biology.

At BIO International Convention 2026, Sabeen Mekan, MD, of Zymeworks discussed how novel payloads, pathway-targeted ADCs, and multispecific antibody technologies are helping shape the next generation of antibody-drug conjugates for cancer treatment.

Jeff Talbot of Roseman University of Health Sciences discusses how Las Vegas is positioning itself as a growing life sciences hub by offering cost-effective laboratory space, access to capital, and a flexible environment for biotech startups and emerging companies.

MilliporeSigma's Sebastian Arana identifies process characterization gaps, tech transfer complexity, and analytical lag as top CGT manufacturing scale-up barriers at BIO 2026.
At BIO International Convention 2026, Mohit Trikha, PhD, CEO of Kiva Bioscience, discussed why emerging human-based preclinical models may have their greatest impact in predicting drug toxicity and tolerability rather than replacing animal testing outright.

Speaking from the show floor at BIO 2026, Dr Anil Kane, Thermo Fisher Scientific's global head of technical and scientific affairs, details how AI partnerships are accelerating drug development decisions across the CDMO continuum.

The FDA's approval of sacituzumab govitecan-hziy for first-line metastatic triple-negative breast cancer validates the Trop-2/SN-38 hydrolyzable linker platform across four positive Phase 3 trials, with implications for ADC development strategy, pharmacogenomic labeling, and biomarker-stratified regulatory programs.
At BIO 2026, Dr Howard Berman, ReAlta Life Sciences’ CEO, explains how an astrovirus-derived anti-inflammatory peptide targets multiple pathways that drive neonatal hypoxic-ischemic encephalopathy (HIE).
At BIO International Convention 2026, Sabeen Mekan, MD, Vice President of Clinical Development at Zymeworks and panelist for The Next Generation of ADCs: Building Kinder, Gentler Cancer Therapeutics, discusses why safety is becoming an increasingly important differentiator in antibody-drug conjugate development and how biomarker-driven patient selection may help guide future treatment decisions.
At the BIO International Convention 2026, oncology drug development expert Mohit Trikha, PhD, CEO, Kivu Bioscience, discusses the promise and limitations of organoids and other human-based preclinical models, emphasizing the need for stronger validation, cross-functional collaboration, and early regulatory engagement to improve clinical trial success rates.

Dr Wyatt McDonnell, Infinimune CEO and co-founder, posits that translatable, decision-linked single-cell data, and not data volume, are what drive effective therapeutic antibody development in this second segment of an interview at BIO 2026.

AbbVie has entered a definitive agreement to acquire Apogee Therapeutics for $10.9 billion, adding zumilokibart, a subcutaneous half-life extended IL-13 monoclonal antibody in Phase 3 development for atopic dermatitis, asthma, and eosinophilic esophagitis.
Speaking at BIO 2026, Infinimune's Dr Wyatt McDonnell explains how the company’s human-derived antibody platform enables multi-objective optimization that AI alone and transgenic models cannot replicate.
Advertisement
Advertisement