


Biopharmaceutical Analysis
Latest News
Advertisement
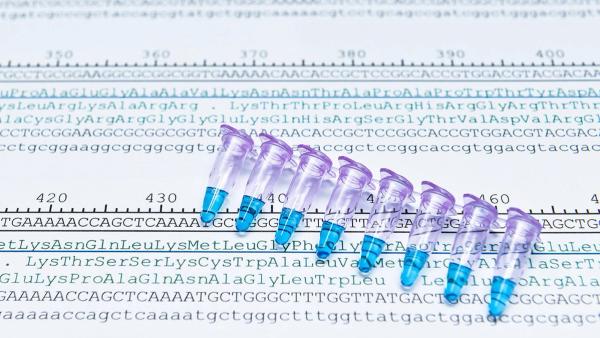
Why Automation with the Correct Liquid Handler is Integral to Improved NGS Outcomes
NGS abbreviates drug discovery timelines.
Biologics Quality Control: The Growing Need for Accessible Proteomics
There is a great need for sensitive, precise, and easily accessible analytical detection techniques for protein sequencing.
Navigating Challenges in Cell Therapy Potency Assays
Developing cell-based potency assays for cell therapies requires meticulous coordination.

Latest Videos


Advertisement
More News
AI-driven protein design, continuous-learning R&D platforms, mechanistic PK/PD modeling, and automated analytical workflows are now foundational tools reshaping how biopharmaceuticals are discovered, characterized, and delivered.
Agilent’s Dr. Ganesh Bala explains how MAM-based LC–MS peptide mapping has become a foundational analytical tool for ADC and bioconjugate CQA monitoring in this Q&A piece.

Webcasts
Webinar Date/Time: Tue, Jun 23, 2026 11:00 AM EDT

Biopharma in 2026 advances decentralized manufacturing, AAV automation, QC modernization, and APAC clinical trial strategy.

Webcasts
Webinar Date/Time: Wed, Jun 24, 2026 11:00 AM EDT

Small molecules to complex biologics: Mastering bioanalytical workflows using high resolution mass spectrometry (HRMS)
BySCIEX
Webcasts
Webinar Date/Time: June 18th, 2026, 11:00am ET
Webcasts
Webinar Date/Time: Tue, Jun 16, 2026 11:00 AM EDT

Circular RNA May Transform AAV Gene Therapy, Says Circio CEO Erik Wiklund
Published: | Updated:
Erik Wiklund discusses how circular RNA-based AAV expression systems may improve gene therapy durability, reduce toxicity, and lower dosing requirements for next-generation therapies.

Predictive Models and Raw Immunogenicity Data Could Reshape Preclinical Development, Says Vibha Jawa
Vibha Jawa, PhD, discussed evolving approaches to preclinical development, animal use reduction, and immunogenicity assessment during an interview with BioPharm International at AAPS NBC 2026.
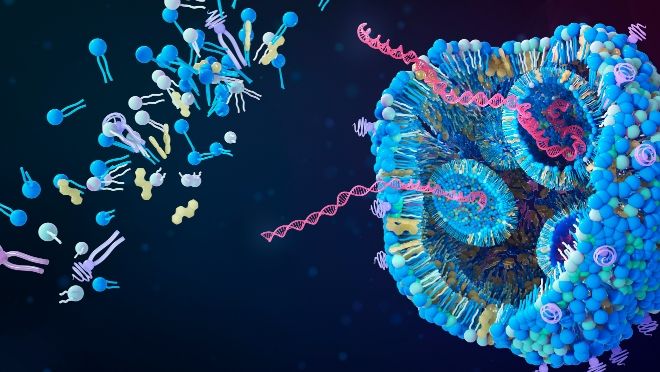
Integra Therapeutics is advancing its FICAT gene writing platform to enable more sophisticated CAR T-cell engineering, combining CRISPR precision with high-capacity DNA integration for next-generation cancer therapies.

For ATMP developers, the greatest barrier to commercialization is often not scientific discovery or funding, but the challenge of translating research-stage processes into reproducible, GMP-compliant manufacturing without compromising the therapy itself.
A new European Union regulatory framework known as MIDBA may streamline auto-injector approvals for biologics by reducing the need for repetitive pharmacokinetic (PK) bridging studies. Charles Theuer discussed how the model-based approach could accelerate drug-device combination development and potentially influence future FDA policy.
At AAPS NPC 2026, Charles Theuer discussed how converting biologics from intravenous (IV) infusion to subcutaneous (sub-q) administration is reshaping patient experience, safety profiles, and regulatory development strategies. The shift toward pharmacokinetic (PK)-based approvals and label extrapolation is enabling faster development of subcutaneous oncology and biologic therapies.
Emerging sequential treatment study designs may simplify and accelerate IV-to-subcutaneous biologic conversions by reducing variability and shrinking clinical trial sizes. Charles Theuer discussed how streamlined pharmacokinetic (PK)-driven regulatory pathways and evolving EU initiatives are reshaping subcutaneous biologic development.
Certara UK’s Dr. Armin Sepp, who spoke at the 2026 AAPS National Biotechnology Conference, explains how quantitative systems pharmacology may improve CAR T-cell safety and efficacy by modeling immune activation, tumor response, and cell persistence.
Yelena Ionova, Pharm.D., Redica Systems, discusses how benchmarking inspection data, strengthening sterile manufacturing controls, and adopting continuous regulatory intelligence strategies can help cell and gene therapy manufacturers improve inspection readiness and quality system performance.
Yelena Ionova, Pharm.D., Redica Systems, described how FDA and EMA standards for cell and gene therapy chemistry, manufacturing, and controls are increasingly aligned, yet manufacturers continue to struggle with basic GMP elements such as quality oversight, sterile processing, and staff training. She emphasized that newer CGT facilities have a critical opportunity to design quality systems and data integrity controls correctly from the outset to avoid costly remediation later.

Multi-attribute LC–MS methods improve characterization of complex bioconjugates, supporting scalable and regulatory-ready biotherapeutic development, says Agilent Technologies’ Dr. Ganesh Bala, who spoke at the 2026 AAPS National Biotechnology Conference.

The opening plenary session at this year’s AAPS National Biotechnology Conference will spotlight AI and NAMs as tools that advance predictive toxicology and human-relevant models to improve drug safety and translational research.

Webcasts
Webinar Date/Time: Thu, May 21, 2026 11:00 AM EDT

Expanding natural chemical space may improve AI drug discovery by providing biologically relevant data to generate more clinically impactful therapeutics, says Guillaume Vandenesch, CEO and co-founder of Generare, in this exclusive interview.

As 2026 marches forward, the biopharma industry finds itself balancing therapeutic innovation with operational discipline across manufacturing, data integrity, and next-gen precision medicine
Webcasts
Webinar Date/Time: Thu, Apr 30, 2026 11:00 AM EDT

CGT is rapidly transforming oncology and rare disease research, with patient-derived models, advanced imaging, CRISPR/Cas9, and 3D organoids driving innovation while solid tumor modeling remains a critical frontier.

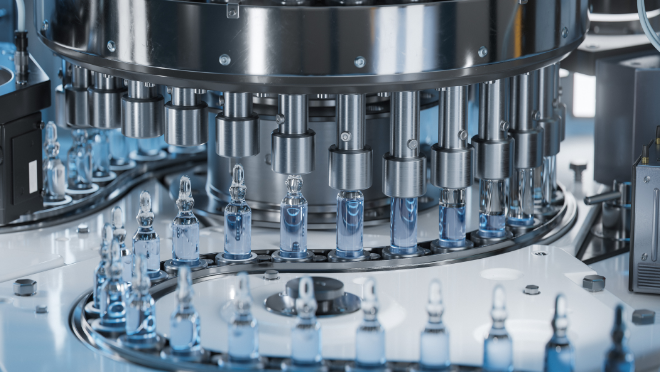
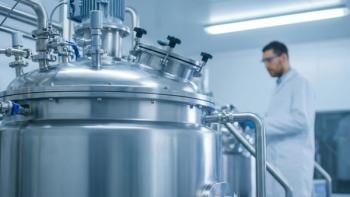
While allowing for high throughput and efficiency, the bulk fill/finish process exerts extreme stress on glass containers, resulting in cosmetic defects and breakage.
Advertisement
Advertisement