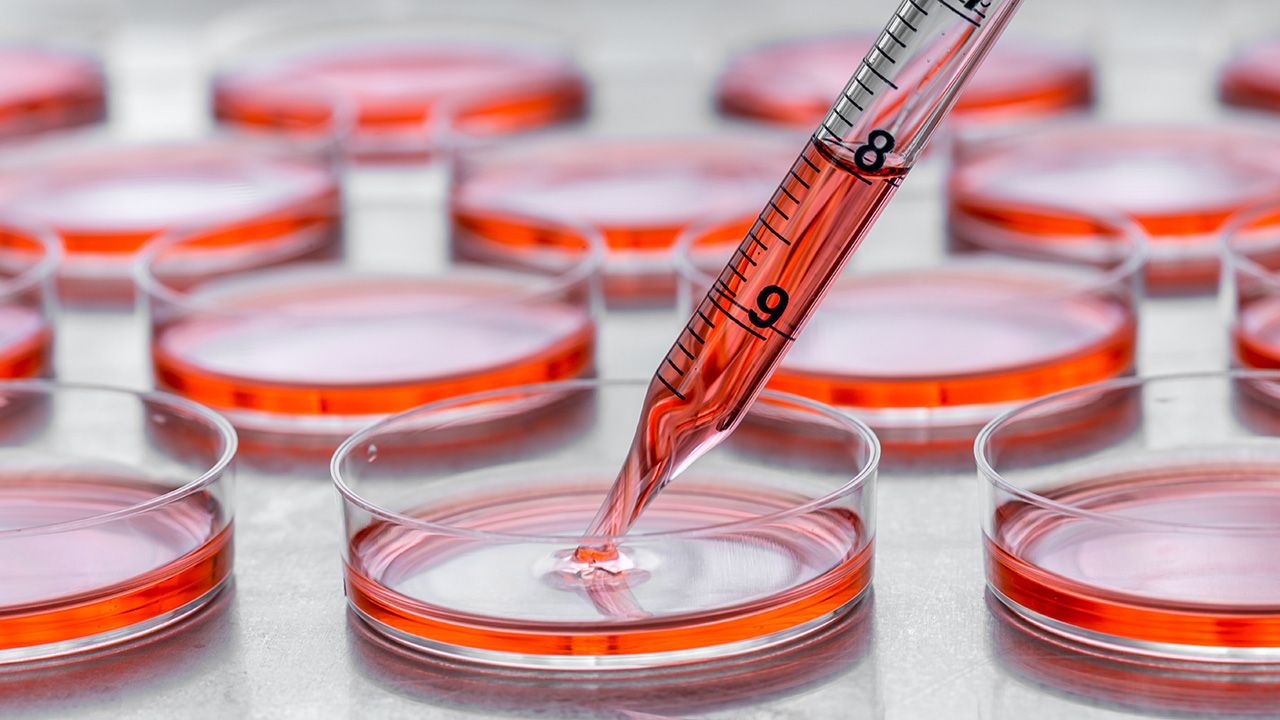
Manufacturing, Cell Culture and Fermentation
Latest News
Advertisement
Latest Videos
Advertisement
More News

The addition of the two larger-volume bioreactor sizes to Cytiva’s Xcellerex X-platform portfolio will allow scientists and researchers to scale up from 50 L to 2000 L to meet growing demand for clinical trials and regulatory approved products.
Cell-line engineering and media formulation improvements are leading to greater performance.
Enduro Genetics will use the funding to expand its cell programming technology for scalable biomanufacturing with microbial cells at its Copenhagen, Denmark site.
Under a £15.7 million (US$20.7 million) investment, SEKISUI has expanded its UK site for clinical-grade drug substance manufacturing.
With financing led by OrbiMed, Novo Holdings, and Jeito Capital, Alentis Therapeutics will develop a pipeline of Claudin-1-targeted ADCs to treat solid tumors.
Optimizing AAV vector manufacturing will be necessary to meet anticipated future market demand.
Scorpius Holdings expects to launch its first CGMP campaign for mammalian-based biomanufacturing in the 2024 third quarter.
Improving the flexibility of cell line development through utilization of platform approaches and suitable partnerships can reduce potential bottlenecks in the development pathway of novel biologics.
AGC Biologics has completed an expansion at its Copenhagen, Denmark, site, which doubles its bioreactor capacity for mammalian-based cell culture.
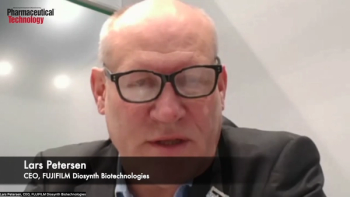
FUJIFILM Diosynth Biotechnologies CEO Lars Petersen highlights the company’s strategic goals and meeting market demand for mammalian cell culture capacity.
This investment will bolster the company’s large-scale cell culture CDMO business at its planned Fujifilm Diosynth Biotechnologies manufacturing facility in Holly Springs, North Carolina.
Challenges in fermentation can be addressed through equipment changes, facility design, and process development.

Both adherent and suspension cell culture approaches have their pros and cons, which must be considered for process development.

CDMOs are actively exploring and leveraging both new and existing technologies to streamline the cell-line development process at every step.
Using a systematic approach and achieving run-to-run consistency are essential.
Process and bioreactor performance are directly impacted by real-time monitoring capabilities.
Scale-up strategies for cell culture will require a deep understanding of overall bioprocess workflows.
MilliporeSigma has invested $25 million to expand its cell culture media production facility in Lenexa, Kan.
Media developers and vector manufacturers face a combination of challenges and opportunities.
Optimization strategies that leverage advanced technologies are essential for maximizing yield and quality.
Avid Bioservices has launched new CGMP mammalian cell manufacturing suites at its Myford, Calif., facility.
The innovation of going from stainless-steel bioreactors to fixed-bed bioreactors shows an evolution in upstream optimization.
Experts reveal how to identify the “right” biochemical, the process of sourcing biochemicals, sourcing challenges, and what industry professionals should know about the space.
Thermo Fisher’s new centrifuge technology is designed to enable efficient, sustainable cell culture harvesting.

The industry revisits the pros and cons of microbial fermentation at scale for biotherapeutics.
Advertisement
Advertisement