


Development
Latest News
Advertisement
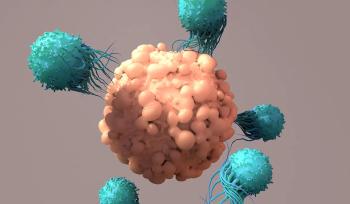
Research into Cold Cancers Heating Up
Accurately targeted immunotherapies through reliable neoantigen recognition enable personalized medicine development.

Proprietary Cell-Line Development for High-Titer AAV Manufacturing
Proprietary cell lines offer opportunities for achieving high AAV titers.

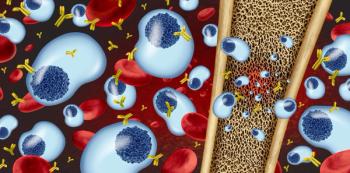
Bracing for a Future Wave of Advanced Therapies
In the ATMP space, CGTs are hitting their stride with unprecedented approvals in the past year alone.

Latest Videos


Shorts

Advertisement
More News

Innovent Biologics and Spero Therapeutics have signed a $1.1 billion licensing deal for IBI355, a phase 2-ready Fc-silent anti-CD40L antibody planned for testing in IgG4-related disease and Sjögren's disease.

The FDA has approved Padcev, a Nectin-4-directed antibody-drug conjugate, plus Keytruda as neoadjuvant and adjuvant treatment for muscle-invasive bladder cancer regardless of cisplatin eligibility, based on Phase III EV-304 data showing a 47% reduction in recurrence risk.

The FDA has granted Regenerative Medicine Advanced Therapy designation to Allocetra, Enlivex's macrophage-reprogramming cell therapy, for age-related symptomatic knee osteoarthritis in patients 64 and older, based on Phase I/IIa data showing durable pain and function improvements.

GSK reports that dostarlimab (Jemperli) monotherapy achieved sustained clinical complete responses in the phase 2 AZUR-1 trial for dMMR/MSI-H locally advanced rectal cancer, with data to be submitted for regulatory review.

Opamtistomig, a PD-L1/4-1BB bispecific antibody from Nanjing Leads Biolabs, has been granted priority review by China's NMPA for advanced extrapulmonary neuroendocrine carcinoma, a rare and aggressive cancer with no globally approved therapy.
The FDA has approved subcutaneous Sarclisa Escena, administered via on-body injector, across all existing multiple myeloma indications for the IV formulation, making isatuximab the first anticancer monoclonal antibody available through both wearable injector and manual subcutaneous administration in the US.

Teva Pharmaceuticals has entered a global licensing agreement with Polpharma Biologics for exclusive commercialization rights to a proposed biosimilar of Ocrevus (ocrelizumab), the CD20-targeted monoclonal antibody used to treat relapsing and primary progressive multiple sclerosis.
Fate Therapeutics Wins FDA IND Clearance for FT839, a Dual-CAR T-Cell Therapy for Autoimmune Disease
FT839, Fate Therapeutics' off-the-shelf, iPSC-derived CAR T-cell candidate co-targeting CD19 and CD38, has received FDA IND clearance and will advance into a phase 1/2 basket trial designed to treat multiple autoimmune diseases without conditioning chemotherapy.

CARDIO-TTRansform, the largest Phase III trial conducted to date in transthyretin-mediated amyloid cardiomyopathy, did not meet its primary composite endpoint for Wainua (eplontersen), though a monotherapy subgroup showed a nominally significant reduction in cardiovascular events.

Chemomab Therapeutics and Scipher Medicine will merge to advance nebokitug, a first-in-class anti-CCL24 monoclonal antibody, into a precision medicine Phase 2 trial in rheumatoid arthritis guided by Scipher's PrismRA test and AI Network Medicine platform.

Webcasts
Webinar Date/Time: Tue, Jun 30, 2026 11:00 AM EDT

Vaccinex will present new biomarker data from the Phase 1b/2 SIGNAL-AD trial of pepinemab — a humanized IgG4 monoclonal antibody targeting Semaphorin 4D — at AAIC 2026 in London on July 13, showing that SEMA4D blockade regulates glial biomarkers associated with disease progression in early Alzheimer's disease, while outlining plans for an enlarged Phase 2b SIGNAL-AD2 study.

The FDA has approved an expanded indication for Wilate (von Willebrand Factor/Coagulation Factor VIII Complex, Human) to include routine prophylaxis in children younger than 6 years with von Willebrand disease — the first FDA-approved option for this age group — based on phase 3 WIL-33 trial data showing significantly reduced bleeding episodes in young pediatric patients.

The FDA has granted accelerated approval to Trutakna, a recombinant fusion protein that simultaneously inhibits BAFF and APRIL, for adults with primary IgA nephropathy at risk for disease progression — marking the first approval of a dual BAFF/APRIL inhibitor in the US and a significant advance in the growing wave of targeted biologics for this immune-mediated kidney disease.

The annual gathering in San Diego showcased the industry's pivot toward complex molecules, flexible manufacturing, and human-based drug discovery — while candid conversations about capital access, deal strategy, and preclinical predictability reflected a sector navigating pressure with optimism.

Because antibody-drug conjugates sit at the interface of antibody biology and small-molecule pharmacology, payload-led design brings those disciplines together, earlier.

Kenai Therapeutics has completed enrollment in the Phase 1b/2a REPLACE trial of RNDP-001, an allogeneic iPSC-derived dopaminergic neuron replacement therapy for idiopathic Parkinson's disease, with safety and preliminary efficacy data expected in 2027 — representing a significant step toward a potential disease-modifying cell therapy for a condition affecting more than 10 million people worldwide.

LTZ Therapeutics has received FDA IND clearance for LTZ-232, a first-in-class bispecific antibody designed to activate tumor-associated macrophages to phagocytose EpCAM-positive colorectal cancer cells — a novel myeloid-engaging approach aimed at overcoming the immunologically cold tumor microenvironment that has historically limited immunotherapy in this setting.

Biocytogen and Whitehawk Therapeutics have announced a global collaboration combining Biocytogen's RenLite bispecific antibody discovery platform with Whitehawk's CPT113-based ADC linker-payload technology to generate bispecific ADC candidates with differentiated tumor-targeting profiles — with Whitehawk targeting new ADC INDs within 12 to 24 months.

The European Commission has approved Tepkinly in combination with lenalidomide and rituximab for adults with relapsed or refractory follicular lymphoma after at least two prior systemic therapies, based on Phase 3 EPCORE FL-1 data showing a 79% reduction in risk of disease progression or death — marking the first bispecific antibody-based combination regimen approved in Europe for this indication.

The FDA has approved a label expansion for Casgevy, the first CRISPR-based gene therapy, lowering the eligible age from 12 to 2 years in sickle cell disease — a move that significantly broadens the potential patient population and marks another milestone in the clinical maturation of CRISPR-based genomic medicine.

Three-year follow-up data from Agenus' Phase 2 trial of botensilimab plus balstilimab in refractory microsatellite-stable metastatic colorectal cancer show a 33% overall survival rate at three years — with evidence of a plateau on the Kaplan-Meier curve beyond two years — representing an unprecedented durability signal in a tumor type historically resistant to immune checkpoint therapy.

CNS monoclonal antibody therapies demand rigorous screening and monitoring to ensure patient safety in MS, NMOSD, and Alzheimer disease.

92Bio, Inc. has dosed the first patient in a Phase 1 trial of NTB-928, a fully human bispecific T-cell engager targeting FOLR1 and CD3, designed to selectively kill FOLR1-overexpressing ovarian cancer cells while sparing normal tissue — addressing a key limitation of prior FOLR1-directed therapies in platinum-resistant ovarian cancer.

A phase 2 controlled human infection trial has found that two doses of WRSs2, a live-attenuated oral vaccine candidate against Shigella sonnei, achieved 89% protection — the highest efficacy reported for any Shigella vaccine candidate — with no serious adverse events, advancing a century-long quest for a licensed vaccine against the diarrheal pathogen.
Advertisement
Advertisement