


Analytical Methods
Latest News
Advertisement
Latest Videos


Advertisement
More News

CGT is rapidly transforming oncology and rare disease research, with patient-derived models, advanced imaging, CRISPR/Cas9, and 3D organoids driving innovation while solid tumor modeling remains a critical frontier.

With Sanofi as one of its backers, Earendil Labs is set to advance its AI-native biologics platform to scale antibody discovery, accelerate IND filings, and expand partnerships in autoimmune and oncology research.

The company is targeting the $3 billion pancreatic cancer market with its lead proenzyme therapy candidate, PRP, which is supported by strong preclinical tumor inhibition data and for which a PK assay will be developed and validated.

Under the collaboration, Merck and Mayo Clinic will integrate multimodal clinical and genomic datasets with AI models to enhance target biology insights and translational decision-making.
Next-gen antibody R&D is shifting to multifunctional modalities driven by manufacturing scale and regulatory acceleration.

In a new team-up, MD Anderson and SOPHiA GENETICS will apply advanced analytics to cancer testing to improve complex data interpretation for clinical use.

Advances in precision analytics have pushed the needle forward in characterizing and assessing the safety and quality of next-gen biologics.

FDA outlines reduced primate testing for monoclonal antibodies, signaling a shift toward modern evaluation tools that may influence drug development practices.

Microfluidic rapid-testing advances enhance real-time QC, strengthen compliance, and speed contamination detection across modern biomanufacturing.
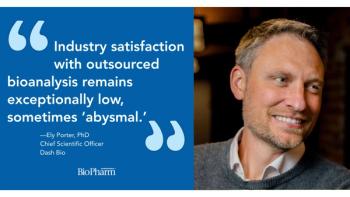
At AAPS PharmSci 360, Ely Porter, PhD, says automated platforms enhance drug production velocity and assay excellence.
Fluorescence spectroscopy with A-TEEM offers rapid, precise monitoring of cell culture media variability for improved biopharmaceutical quality control.

Naobios and Olon France create custom HCP ELISA to advance vaccine trials and strengthen global biopharmaceutical manufacturing capacity.

Data integrity and quality are paramount for drug discovery, manufacturing efficiency, regulatory compliance, and patient safety.

The acquisitions include three testing laboratories that enhance Normec’s ability to serve key highly regulated sectors in the TICC industry.

This article provides an overview and introduction to the use of analytics in biopharmaceutical development and manufacturing.
The shift toward personalized medicines poses new challenges in cleanroom protocols.

Under this collaboration, GSK and Oxford will combine their complementary expertise in the immune system, vaccines, and cancer biology.
With the launch of its cobas mass spectrometry solution, Roche brings fully automated mass spec analysis to the clinical lab.

Fluorescence spectroscopy offers unique advantages for characterizing EVs.
Viral vectors and other complex biologic modalities require more specificity and higher sensitivity to detect and distinguish contaminants.
With the acquisition, Olink will join Thermo Fisher’s Life Sciences Solutions business.

Determining E&L risk from single-use components can be used to build the level of extractable profiling and PERLs.

Biosimilar analytical assessments focus on demonstrating biosimilarity and interchangeability with the reference biologic.

Studies conducted by a team at Oxford Biomedica demonstrated that HIC can be used to effectively separate non-deamidated capsids from deamidated capsids.

Digital transformation is allowing for better handling, analysis, and protection of vast data collection.
Advertisement
Advertisement