


FDA backs the benefits of adopting continuous manufacturing, a strategy which has accelerated approval and launch timelines, and its Emerging Technology Program could be a helpful tool.
FDA backs the benefits of adopting continuous manufacturing, a strategy which has accelerated approval and launch timelines, and its Emerging Technology Program could be a helpful tool.

Connect with pharmaceutical and healthcare regulatory authorities around the world via this directory.


Find links to pertinent regulatory and standard setting resources, guidance documents, and guidelines.

Connect with pharmaceutical and healthcare regulatory authorities around the world via this directory.
Global regulatory authorities have published a report describing the aligned positions on COVID-19 vaccine development, which were agreed upon by meeting participants of the second workshop on COVID-19 vaccine development.
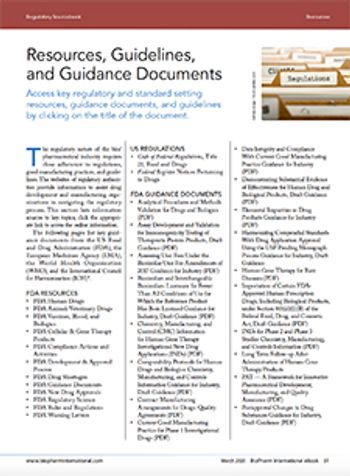
Find links to pertinent regulatory and standard setting resources, guidance documents, and guidelines.
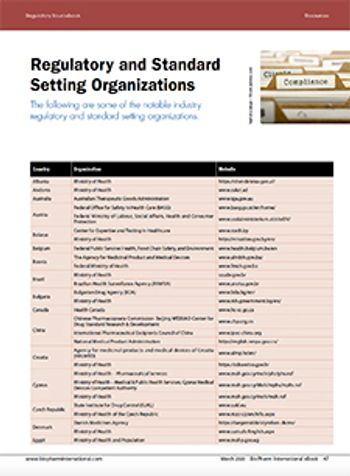
Connect with pharmaceutical and healthcare regulatory authorities around the world via this directory.
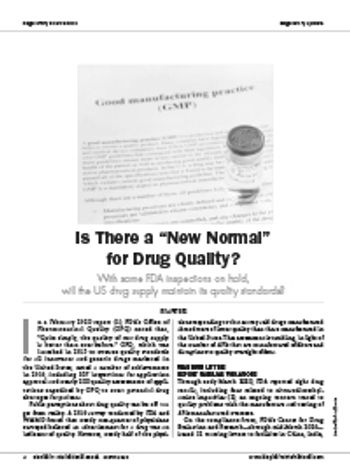
With some FDA inspections on hold, will the US drug supply maintain its quality standards?
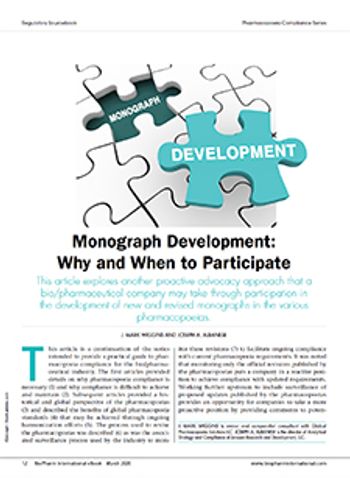
Monographs are developed based on the submission of information and materials from a company having regulatory approval for the product, and this submission feeds into the pharmacopoeia revision process.
This final article in the series has two purposes: to summarize all the considerations that go into a company’s compendial affairs program and to look ahead at topics that will likely result in further evolution in the pharmacopoeias around the world.
This article returns to the topic of complying with pharmacopoeial requirements with a case study at the intersection of monograph development and compliance.

The revision process and the resulting publication of proposed and official updates for pharmacopoeias around the world are described.
This article describes the revision process and the resulting publication of proposed and official updates for pharmacopoeias around the world.

An effective surveillance program for monitoring the activities of pharmacopoeias around the world requires processes, people, and tools from across a company.
An effective surveillance program for monitoring the activities of pharmacopoeias around the world requires processes, people, and tools from across a company.
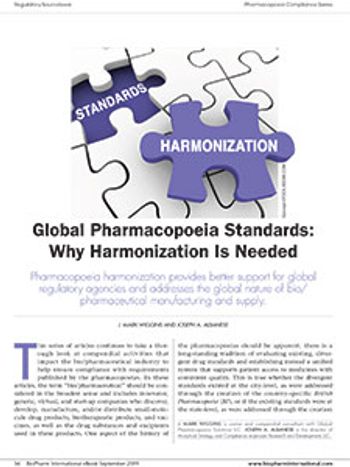
An understanding of global and national pharmacopoeias is crucial to understanding change processes and access to different markets.
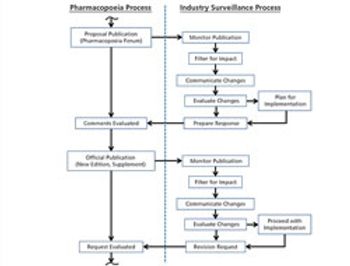
The process used to monitor and participate in pharmacopoeial changes is described.
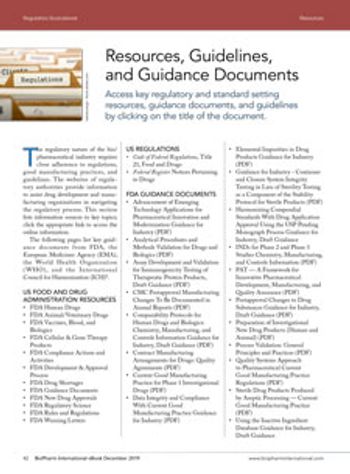
Find links to pertinent regulatory and standard setting resources, guidance documents, and guidelines.
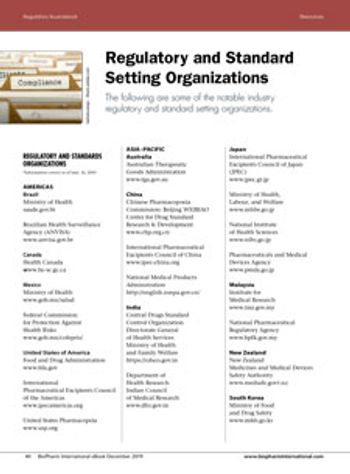
Connect with pharmaceutical and healthcare regulatory authorities around the world via this directory.
In this series of articles, the authors provide an understanding about the need for pharmacopoeia compliance and practical guidance to assist those who perform this work.
In this series of articles, the authors provide an understanding about the need for pharmacopoeia compliance and practical guidance to assist those who perform this work.
In this series of articles, the authors provide an understanding about the need for pharmacopoeia compliance and practical guidance to assist those who perform this work.
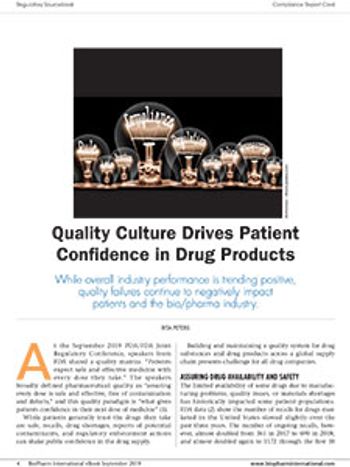
While overall industry performance is trending positive, quality failures continue to negatively impact patients and the bio/pharma industry.
While downgrading the impact of nitrosamine impurities on patients, FDA vows to step up investigations for other drug types.