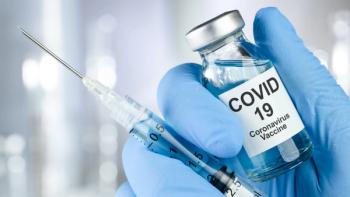
Identification and Quantification of Trace-Level Protein Impurities

Published on: 
, , , ,
BioPharm International, BioPharm International-09-01-2013, Volume 26, Issue 9

A simple, sensitive, and universal platform for identification and quantification of trace-level protein impurities in biotherapeutics is described.

IgG monoclonal antibody spiked with low abundant proteins was used as the model to test the assay sensitivity and dynamic range. The simultaneous qualitative and quantitative analysis of low abundance proteins was achieved with single injection on a hybrid quadrupole-orbitrap mass spectrometer. This LCMS based approach can be applied for host-cell proteins generated during drug process development by recombinant DNA technology.

Host-cell proteins (HCPs) accompanied with recombinant biotherapeutics can significantly affect drug efficacy and cause immunogenicity. Detection and quantification of residual HCPs as potential process-related impurities is crucial for biopharmaceutical companies in accordance with regulatory agency guidelines (1). Current analytical methods suffer from long method development times, require prior knowledge of contaminant proteins, and lack the ability to detect a wide range of protein concentrations. Liquid chromatography-mass spectrometry (LC-MS) has been used for HCPs analysis, but qualitative and quantitative studies are traditionally performed using two different MS platforms because of the sensitivity limitations of high-resolution MS. A sensitive and universal assay using nano-flow LC coupled with a hybrid quadrupole-orbitrap mass spectrometer (Q Exactive, Thermo Scientific) was evaluated for simultaneous identification and quantification of low abundant proteins in biotherapeutic products.

MethodsSample preparation
Four protein standards, lysozyme (14 kDa), carbonic anhydrase (29 kDa), cytochrome C (12 kDa), and bovine serum albumin (67 kDa) were spiked in 1mg/mL of IgG monoclonal antibody (mAb) to final relative concentrations of 5-1000 ppm. The mixture was denatured, reduced, and alkylated, then equal amounts of stable isotope-labeled peptides were spiked in each level. After trypsin digestion (1/20=protein/enzyme, 37∘C overnight), samples were desalted using reversed-phase tips (Pierce C18 Spin Tips, Thermo Scientific).

Table I: Liquid chromatography conditions.

Time (min)Flow (nL/min)Mixture (%B)
02502
52502
13025025
16025040
16525095
18025095

Liquid chromatography
Trypsin digested mAb samples were analyzed on a liquid chromatograph (EASY-nLC 1000, Thermo Scientific) coupled with a hybrid quadrupole-Orbitrap mass spectrometer (Q Exactive, Thermo Scientific). Peptides were trapped using a C18 column (75 μm x 2 cm) (Acclaim PepMap,Thermo Scientific) and separated on a 75 μm x 50 cm column (EASY-Spray PepMap C18, Thermo Scientific) with an integrated emitter heated at 40∘C at a flow rate of 250 nL/min with Solvent A (0.1% formic acid in H2O) and Solvent B (0.1% formic acid in acetonitrile) (see Table I).

Table II: Parameters of mass spectrometer (MS).

Advertisement

1800V

Capilary temperature (+)250 oC
Sheath gas (+)0
Auxillary gas (+)0
Sweep gas (+)0
Heater temperature (+) 0 oC
Isolation window (+)           2 m/z
Normalized collision energy (HCD)27
S-lens 50

Positive MS Scan: 1 microscan; Full scan R = 140,000; AGC = 3e6; IT = 120 ms; Scan range: m/z 400-1800; Lock mass: off. Top 10 data-dependent MS/MS: R = 17,500; AGC = 1e5; IT = 250ms; First mass: 130 m/z.  AGC is automatic gain control, IT is inject time, R is resolution.

Mass spectrometry
The hybrid quadrupole-orbitrap mass spectrometer (see Figure 1) equipped with a nano source (EASY-Spray, Thermo Scientific) was employed for MS analysis. Methods were set with full scan (140,000 resolution) and top 10 data-dependent MS/MS (17,500 resolution) in positive mode. The MS parameters are shown in Table II.

Data analysis
The identification of protein impurities was performed using database searching software (Proteome Discoverer, Revision 1.4, Thermo Scientific). The quantitative analysis of those proteins was performed using peptide quan software (Pinpoint, Revision 1.3, Thermo Scientific).

ResultsIdentification of low abundanceprotein impurities
Four proteins with molecular weights from 10k to 70 kDa were spiked in 1 mg/mL of mAb (150 kDa) to demonstrate the sensitivity and dynamic range of the nano LCMS based assay. In the presence of a large amount of mAb and high background noise, selectivity was increased by using high resolving power at 140,000 full width at half maximum (FWHM) in full-scan and data-dependant MS/MS at 17,500 (FWHM).

Data were searched using an algorithm (SEQUEST, University of Washington) with Percolator peptide validation (1% false discovery rate [FDR]) against a customized database with targeted mAb and possible protein impurities.

Searching parameters were set as: precursor mass tolerance: 15 ppm; fragment mass tolerance: 20 mmu; enzyme: trypsin; missed cleavage: 2; dynamic modification: methionine oxidation; N-terminal: Gln to Pyro-Glu; Static modification: Carbamidomethylation on cysteine. The searching results were filtered with high peptide confidence and peptide rank number one.

Lysozyme, bovine serum albumin, and carbonic anhydrase were identified at 10 ppm with the sequence coverage of 34.92%,18.8%, and 5.1% because of the ionization efficiency difference of the enzymatically cleaved peptides. Figure 2 shows the sequence coverage of lysozyme. The concentration is 10 ppm relative to 1 mg/mL IgG. Amino acids highlighted in green are the identified peptides based on fragment ions matched with theoretical ones. The modified amino acids (AA) were also indicated above the AA in Figure 2 (i.e., cysteine 24 was carbamidomethylated, and methionine 30 was oxidized).

Among four identified peptides for lysozyme, NTDGSTDYGILQINSR eluted at 92 min. Figure 3 shows the isotope distribution of the peptide at charge 2+, and the three major isotopes are indicated with a red star. The sequence was confirmed by a good match of the experimental MS/MS spectrum from the precursor ion 877.4216 m/z to the theoretical one (877.4212 m/z) (see Figure 4).

Targeted protein quantification on the hybrid quadrupole-orbitrap mass spectrometer (Q Exactive, Thermo Scientific) can be performed by full scan, selected ion monitoring (SIM), and targeted MS/MS or parallel reaction monitoring (PRM). SIM and MS/MS, or PRM provide better sensitivity and selectivity compared to full scan. A full-scan method, however, is ideal for simultaneous quantitative/qualitative applications in discovery research.

With a full-scan method, the targeted peptide is quantified using the integrated area of the extracted ion chromatogram of the monoisotopic mass or sum of the different isotopes. The post translation modifications (PTMs) of peptides can also be identified.

Proteome Discoverer Software search results (msf files) were imported to Pinpoint Software to automatically generate the accurate mass of isotopes or MS/MS fragment ions based on the identified peptide sequence. The signature peptides from different proteins were selected for the quantitation.

Quantification of lysozyme and carbonic anhydrase in human IgG sample
Lysozyme was quantified using the signature peptide NTDGSTDYGILQINSR. The signals of three most abundant isotopes at charge 2+, 877.4212, 877.9226 and 878.4240 m/z (in green, purple, and blue, respectively in Figure 5b) were summed for quantification. Integrated peak area in Figure 6 shows the concentration dependent increase. The calibration curve was generated with duplicate sample injections. Good linearity was observed from 10 ppm (10 pg/μL in IgG sample) to 1000 ppm with R2=0.991 (Figure 5a).

SEQUEST search results demonstrated the sequence coverage of carbonic anhydrase was 42.31% in the IgG spiked at 1000 ppm. Three isotopes at charge 2+ of peptide QSPVDIDTK, 501.7588 (green in Figure 7b), 502.2602 (purple), and 502.7615 (blue) m/z were integrated to generate calibration curve. Figure 7a shows good linearity with R2=0.996, 1/X, dynamic range: 10-1000ppm (fg/μL, actual concentration).

Conclusion
A simple, sensitive, and universal platform was developed for identification and quantification of trace-level protein impurities in biotherapeutics. IgG monoclonal antibody spiked with low abundant proteins was used as the model to test the assay sensitivity and dynamic range. The observed dynamic range was 5 orders of magnitude. Lysozyme, carbonic anhydrase, and bovine serum albumin were detected at 5 ppm level relative to 1 mg/mL of IgG antibody. Good linearity was observed over the range of 10-1000 ppm for Lysozyme and carbonic anhydrase in the presence of IgG, with correlation coefficients (R2) of 0.991 and 0.996 (n=2), respectively. The simultaneous  qualitative  and quantitative analysis of low abundance proteins was achieved with single injection on a hybrid quadrupole-orbitrap mass spectrometer. This LCMS based approach can be applied for host-cell proteins generated during drug process development by recombinant DNA technology.

Reference
1. EMA, ICH Harmonized Tripartite Specifications: Test procedures and acceptance criteria for biotechnological/biological products, Q6b 2009, http://www.emea.europa.eu/docs/en_GB/document_library/Work_programme/2009/10/
WC500004664.pdf.  

About the Authors
Hongxia (Jessica) Wang is senior marketing specialist, Zhiqi Hao is biopharma program manager, Yi Zhang is senior marketing specialist, David Horn is senior program manager, and Patrick Bennett* is marketing director, patrick.bennett@thermofisher.com;
all at Thermo Fisher Scientific, San Jose, CA, USA.
*To whom all correspondence should be addressed.